Discover how benchmarking in Google Analytics 4 can give your business a unique competitive advantage. Learn how to compare metrics and improve your digital strategy.
One thing is certain: only looking at our own data can be an ego trip. “We had 30,000 sessions this month!” — Okay, cool. But… what about the rest of the market? Are they at 50,000? 5,000?
This is where Benchmarking in Google Analytics 4 (GA4) comes in—a new feature already available in your account that lets you compare your site’s performance with similar companies. And no, it’s not magic—it’s smart data analysis.
Ready to dive in?
Contents
What is benchmarking in Google Analytics 4?
Benchmarking is a feature that allows you to compare your website’s performance with the market, based on:
- Industry category
- Geographic region
- Traffic volume
Instead of guessing whether you’re doing well or not, GA4 shows you the market median, the range between the 25th and 75th percentiles, and where you stand. This way, you can clearly see where you excel and where you might be missing opportunities
See more: The Complete Guide to Filtering AI Traffic in Google Analytics 4
How to use benchmarking in Google Analytics 4
Follow these quick steps:
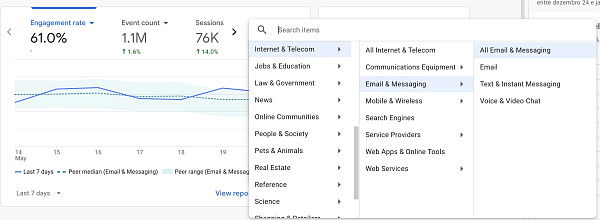
- Go to the GA4 home page.
- In the overview card, choose the metric you want to analyze.
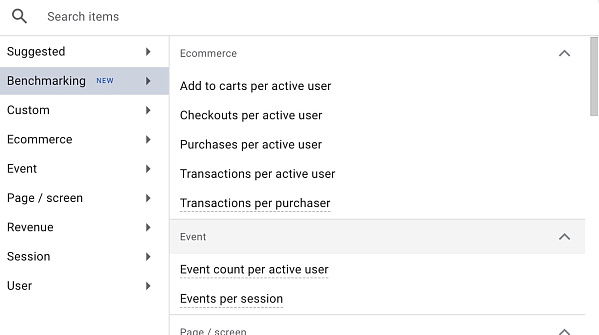
- Click to expand the Benchmarking section.
- Select the metric you want to compare.
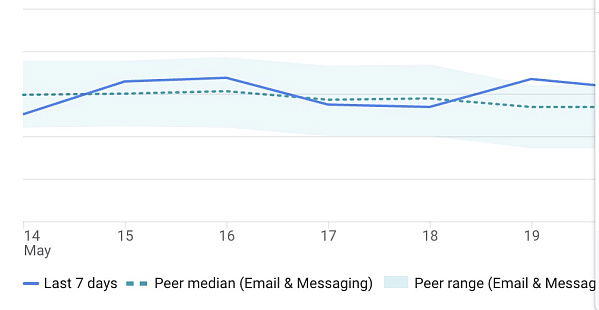
From there, GA4 displays:
- Solid line = your performance
- Dotted line = the median of your comparison group
- Shaded area = the range between the 25th and 75th percentiles
What can you compare?
Here are some interesting metrics you can (and should) analyze:
- New user rate
- Average session duration
- Engagement rate
- Views per session
- Bounce rate
- Active users (DAU/WAU/MAU)
- Average revenue per user (ARPU)
These are just some of the possible metrics, but GA4 offers much more—things get even more interesting when you start cross-referencing metrics with campaigns.
Customizing your comparison group
Not all markets are the same—comparing a jewelry e-commerce site with a delivery app just doesn’t make sense. That’s why GA4 lets you customize:
- Industry category
- Geographic location
- Traffic volume
Real example:
If your company receives traffic from Portugal and Brazil, GA4 will compare you with similar businesses in those countries. If you have 30,000 users/month, it will group you with companies in the same traffic range (e.g., 10k–50k).
Important note: You can’t choose specific companies (Google protects others’ identities). You only have access to aggregated data, which is more than enough to understand the overall landscape.
Why is benchmarking in GA4 so useful?
As a PPC Manager, this is gold,
You can see if your campaigns are really bringing in more qualified traffic (with higher average session time, for example), or if you’re just pouring water into a leaky bucket.
You can also align your content strategy based on metrics where the market is performing better.
For example, if the market has a bounce rate of 35% and you’re at 60%, it’s a sign something on your site needs fixing.
Data-Driven decisions (not just a feeling)
According to Google, Benchmarking helps companies make more informed decisions, based on real industry data.
A Deloitte study revealed that companies using benchmarking are 45% more likely to report faster growth compared to competitors.
And according to MarketingProfs, 67% of marketers who use benchmarking feel more confident in their strategic decisions.
Conclusion
Benchmarking in Google Analytics 4 is like an X-ray mirror: it shows us more than just our reflection—it reveals where we’re shining and where we need a strategic tune-up.
If you’re like me and want strong arguments to justify decisions, enable this feature now.